


 128 / 300

128
•
Annual Report 2016-17
Sr.
No
Name of Shareholder
No. of Shares Percentage holding
5.
ICICI Prudential Value Discovery Fund
1,295,374
1.62
6.
Ashutosh Vinayak Joshi
1,117,946
1.40
7.
FI/ Investments (Mauritius) /td.
1,081,966
1.35
8.
SBI Magnum Ta[gain Scheme
1,000,000
1.25
9.
University Of Notre Dame Du /ac
932,528
1.16
Total
16,017,818
20.01
* Shares held by Mr. Nitin S. Kulkarni jointly with Mr. Vikas Sawant, as Trustees of PSP/ ESOP Management Trust as on March 31, 2017.
xvi. Market Price Data
The equity shares of the Company were listed on the National Stock E[change of India /imited (NSE) and the BSE
/imited (BSE) on April 6, 2010. Accordingly, the highest traded price and the lowest traded price and total volume for
the period from April 1, 2016 to March 31, 2017 on a monthly basis are as below:
Month ended
¡
----------------- BSE -----------------
¢ ¡
----------------- NSE -----------------
¢
High
(
`
)
Low
(
`
)
Total Volume
(No.)
High
(
`
)
Low
(
`
)
Total Volume
(No.)
April 2016
782.00
705.00
0.23
784.90
706.25
2.05
May 2016
743.00
699.90
0.23
744.75
707.90
1.10
June 2016
737.50
670.00
0.12
738.00
670.00
1.20
July 2016
710.00
625.00
0.26
705.00
622.75
1.80
August 2016
693.70
606.50
0.15
693.90
600.90
1.30
September 2016
645.00
501.10
0.21
646.70
591.80
2.40
October 2016
706.95
635.05
0.17
707.00
635.35
1.95
November 2016
666.00
583.50
0.51
667.00
583.15
3.10
December 2016
632.60
586.00
0.16
634.90
584.05
1.20
January 2017
661.00
591.00
0.15
661.50
590.00
1.70
February 2017
647.80
581.00
0.12
649.00
580.00
1.23
March 2017
644.00
588.00
0.25
645.00
590.15
3.09
(Source:
www.bseindia.comand
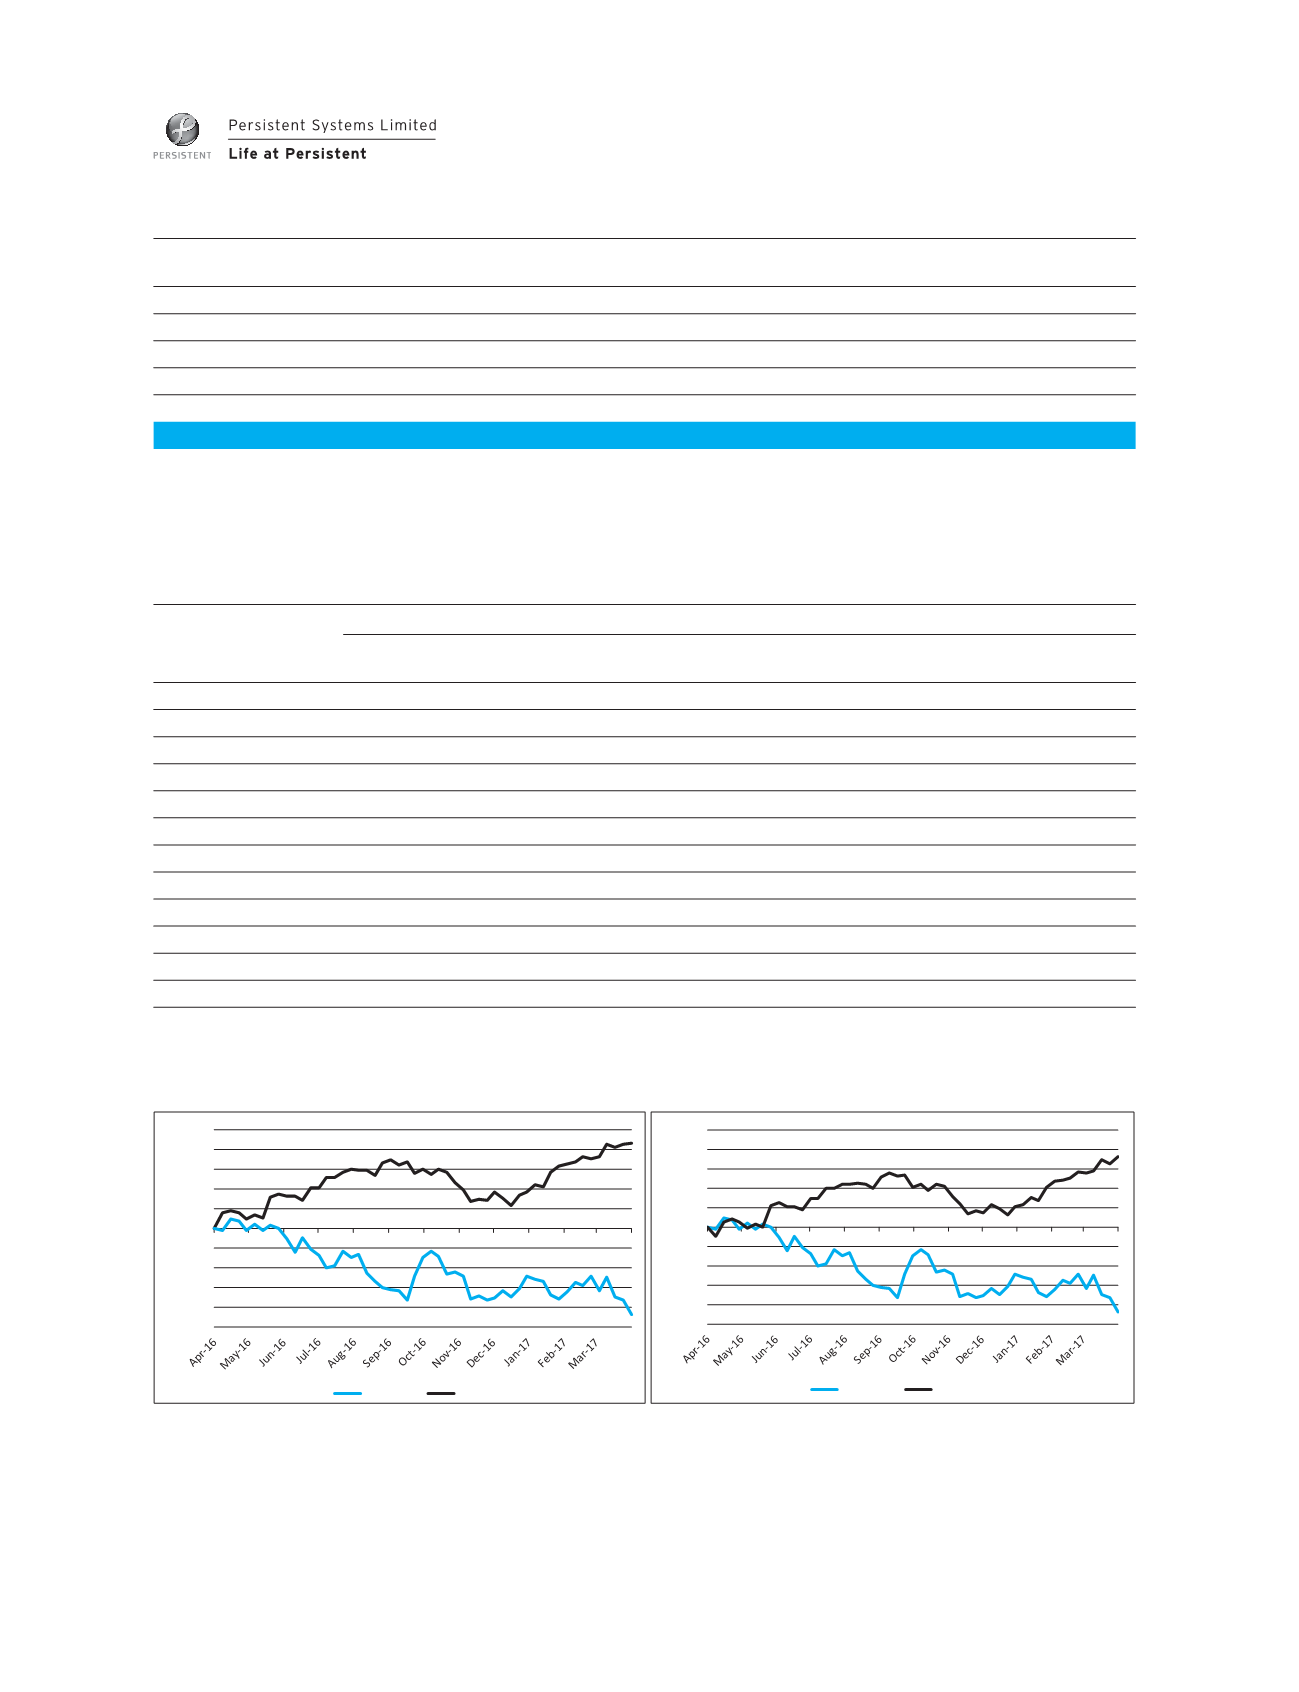
www.nseindia.com)Graphical presentation of movement of Company’s stock price as compared to Nifty and Sense[ from
April 1, 2016 to March 31, 2017 is as follows: -
-25.0%
-20.0%
-15.0%
-10.0%
-5.0%
0.0%
5.0%
10.0%
15.0%
20.0%
25.0%
Persistent
NIFTY
-25.0%
-20.0%
-15.0%
-10.0%
-5.0%
0.0%
5.0%
10.0%
15.0%
20.0%
25.0%
Persistent
BSESensex