


 309 / 327

Shaping the future of software driven business
Unconsolidated Financials •
309
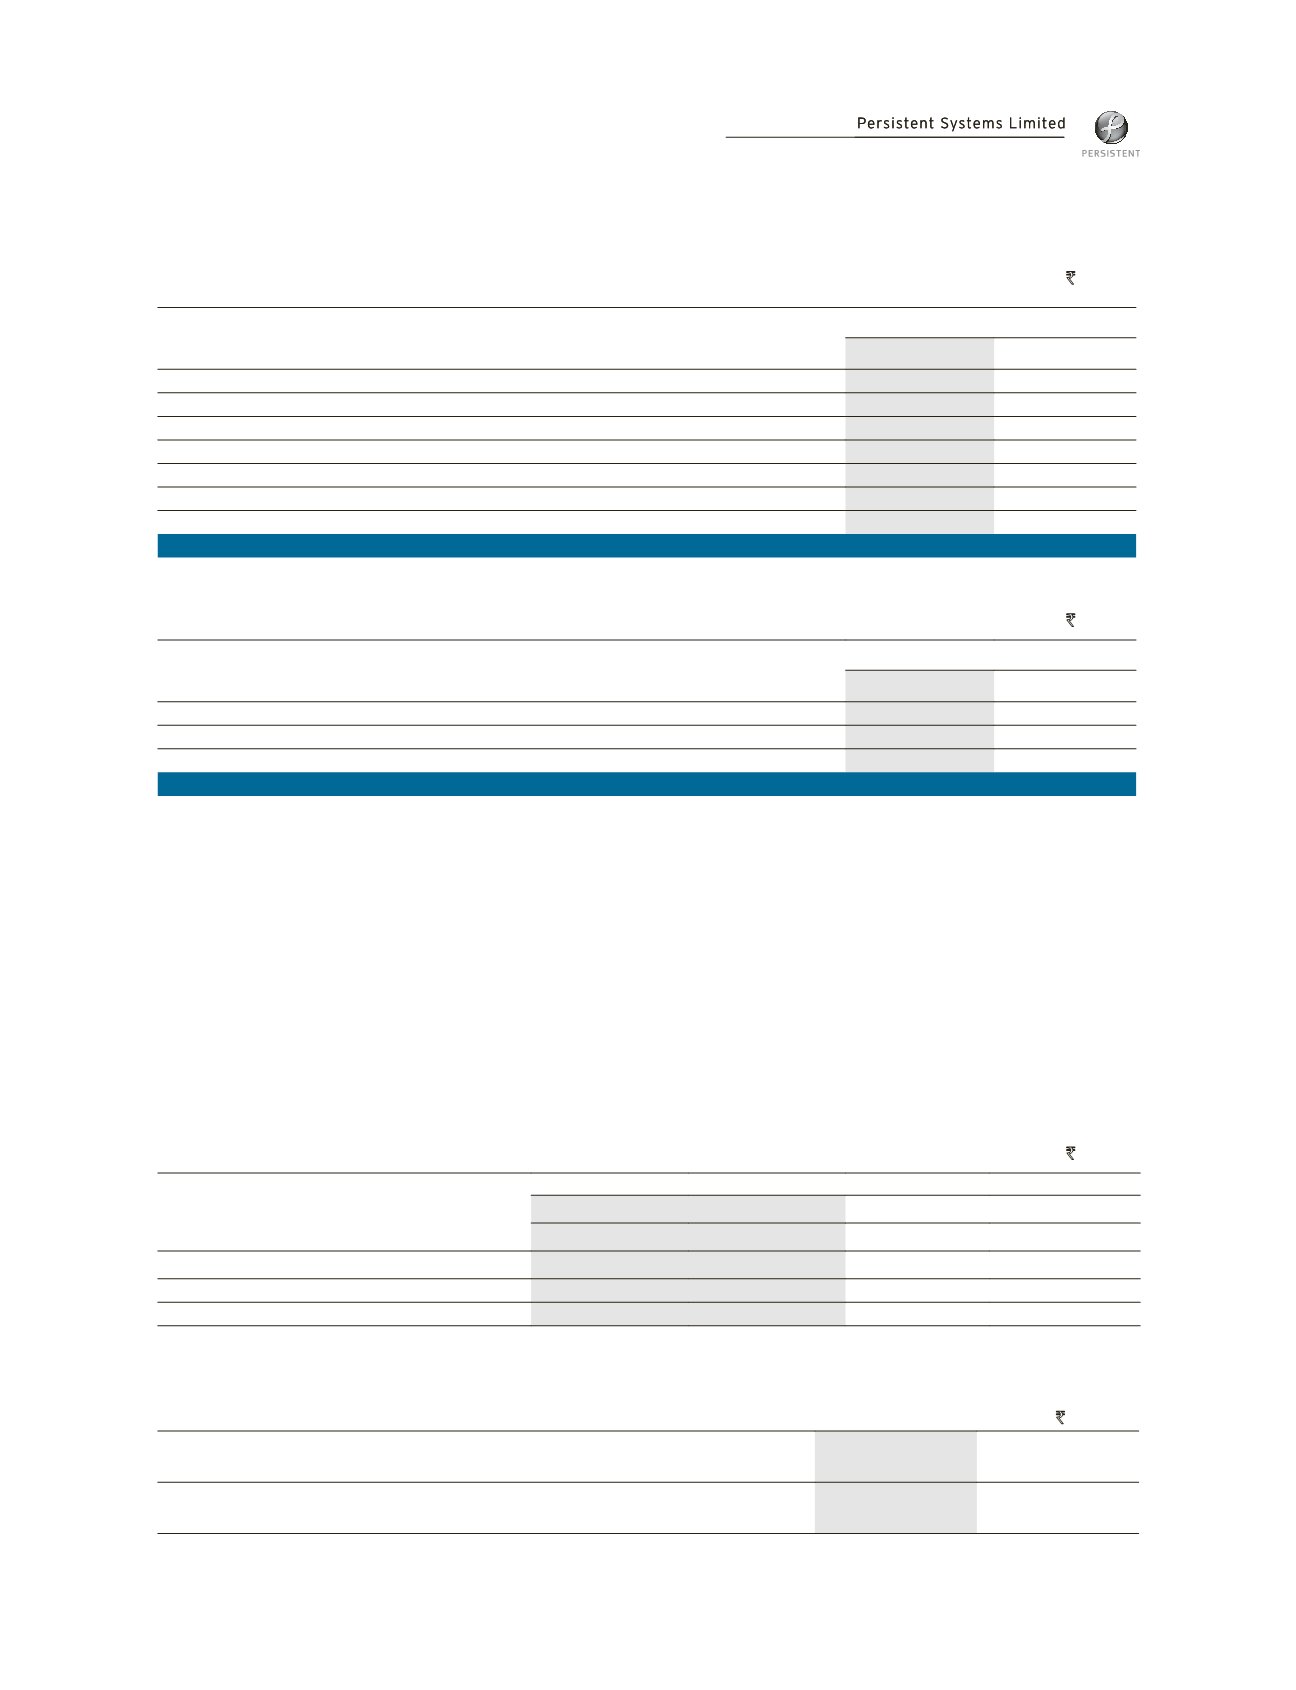
Ageing of trade receivables
(In
`
Million)
As at
March 31, 2019
March 31, 2018
Within the credit period
2,138.01
2,449.49
1 to 30 days past due
2.34
384.43
31 to 60 days past due
64.57
16.56
61 to 90 days past due
54.59
244.65
91 to 120 days past due
47.35
49.94
121 and above past due
196.65
360.20
Less: Expected credit loss
(73.66)
(80.20)
Net trade receivables
2,429.85
3,425.07
Movement in expected credit loss allowance
(In
`
Million)
As at
March 31, 2019
March 31, 2018
Opening balance
80.20
223.59
Movement in expected credit loss allowance
(6.99)
(146.42)
Translation differences
0.45
3.03
Closing balance
73.66
80.20
Credit risk on cash and cash equivalents is limited as the Company generally invests in deposits with banks and financial
institutions with high credit ratings. Investments primarily include investment in debts mutual funds, quoted bonds.
Liquidity risk
The Company’s principal sources of liquidity are cash and cash equivalents and the cash flow that is generated from operations.
The Company has no outstanding bank borrowings. The investment of surplus cash is governed by the Company’s investment
policy approved by the Board of Directors. The Company believes that the working capital is sufficient to meet its current
requirements. Accordingly, no liquidity risk is perceived.
As at March 31, 2019, the Company had a working capital of
`
11,884.14 million including cash and cash equivalents and current
fixed deposits of
`
5,408.63 million and current investments of
`
3,295.53 million. As at March 31, 2018, the Company had a
working capital of
`
11,652.07 million including cash and cash equivalents and current fixed deposits of
`
2,046.12 million and
current investments of
`
5,916.31 million.
The table below provides details regarding the contractual maturities of significant financial liabilities:
(In
`
Million)
As at
March 31, 2019
March 31, 2018
Less than 1 year More than 1 year
Less than 1 year More than 1 year
Borrowings (including accrued interest)
4.75
11.97
5.36
16.55
Trade payables and deferred payment liabilities
1,019.07
-
716.73
-
Other financial liabilities (excluding borrowings)
135.25
-
285.50
-
32. Derivative instruments and un-hedged foreign currency exposures
(i) Forward contracts outstanding at the end of the year:
(In
`
Million)
As at
March 31, 2019
As at
March 31, 2018
Forward contracts to sell USD: Hedging of expected future receivables of USD 112
Million (Previous year USD 103 Million)
8,175.45
6,895.53
Notes forming part of financial statements (Contd.)