


 273 / 300

Notes forming part of onancial statements (Contd.)
Annual Report 2016-17
•
273
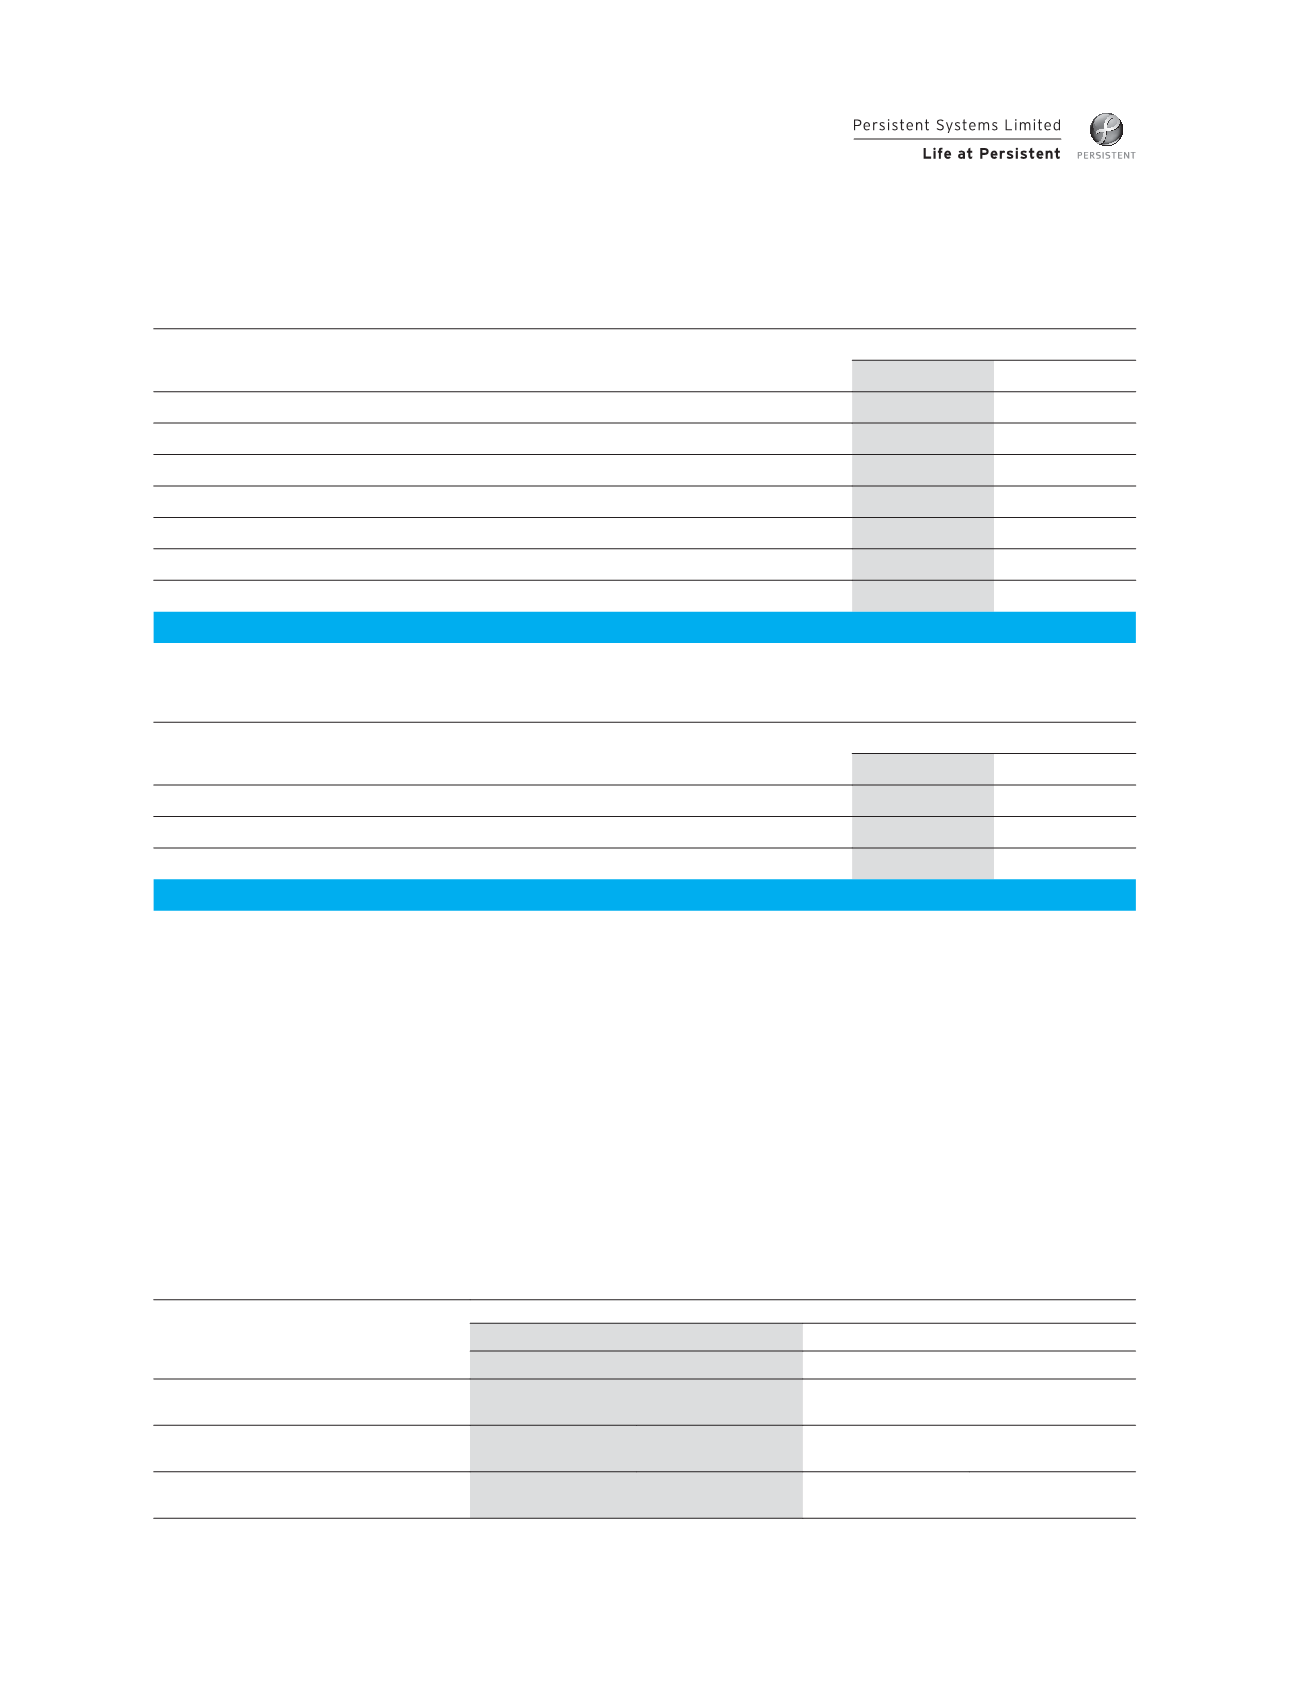
Ageing of trade receivables
(In
`
million)
As at
March 31, 2017
March 31, 2016
Within the credit period
2,743.60
2,974.80
1 to 30 days past due
406.60
346.06
31 to 60 days past due
168.30
104.04
61 to 90 days past due
1,158.22
232.04
91 to 120 days past due
72.12
71.12
121 and above past due
456.10
301.96
/ess: Expected credit loss
(223.59)
(214.95)
Net trade receivables
4,781.35
3,815.07
Movement in expected credit loss allowance
(In
`
million)
As at
March 31, 2017
March 31, 2016
Opening balance
214.95
328.58
Movement in expected credit loss allowance
15.94
(136.24)
Translation differences
(7.30)
22.61
Closing balance
223.59
214.95
Credit risk on cash and cash equivalents is limited as the Company generally invests in deposits with banks and onancial
institutions with high credit ratings. Investments primarily include investment in debts mutual funds, tax free quoted
bonds.
Liquidity risk
The Company’s principal sources of liquidity are cash and cash equivalents and the cash pow that is generated
from operations. The Company has no outstanding bank borrowings. The investment of surplus cash is
governed by the Company’s investment policy approved by the Board of Directors. The Company believes that
the working capital is sufocient to meet its current requirements. Accordingly, no liquidity risk is perceived.
As at March 31, 2017, the Company had a working capital of
`
9,312.18 million including cash and cash equivalents
and current oxed deposits of
`
627.11 million and current investments of
`
4,499.66 million. As at March 31, 2016, the
Company had a working capital of
`
9,101.18 million including cash and cash equivalents of
`
528.76 million and current
investments of
`
4,914.36 million.
The table below provides details regarding the contractual maturities of signiocant onancial liabilities:
(In
`
million)
As at
March 31, 2017
March 31, 2016
Less than 1 year
More than 1 year
/ess than 1 year
More than 1 year
Borrowings (including accrued
interest)
5.53
21.71
5.77
26.91
Trade payables and deferred payment
liabilities
1,178.77
-
1,055.67
-
Other onancial liabilities (excluding
borrowings)
112.87
-
107.62
-