


 156 / 300

156
•
Annual Report 2016-17
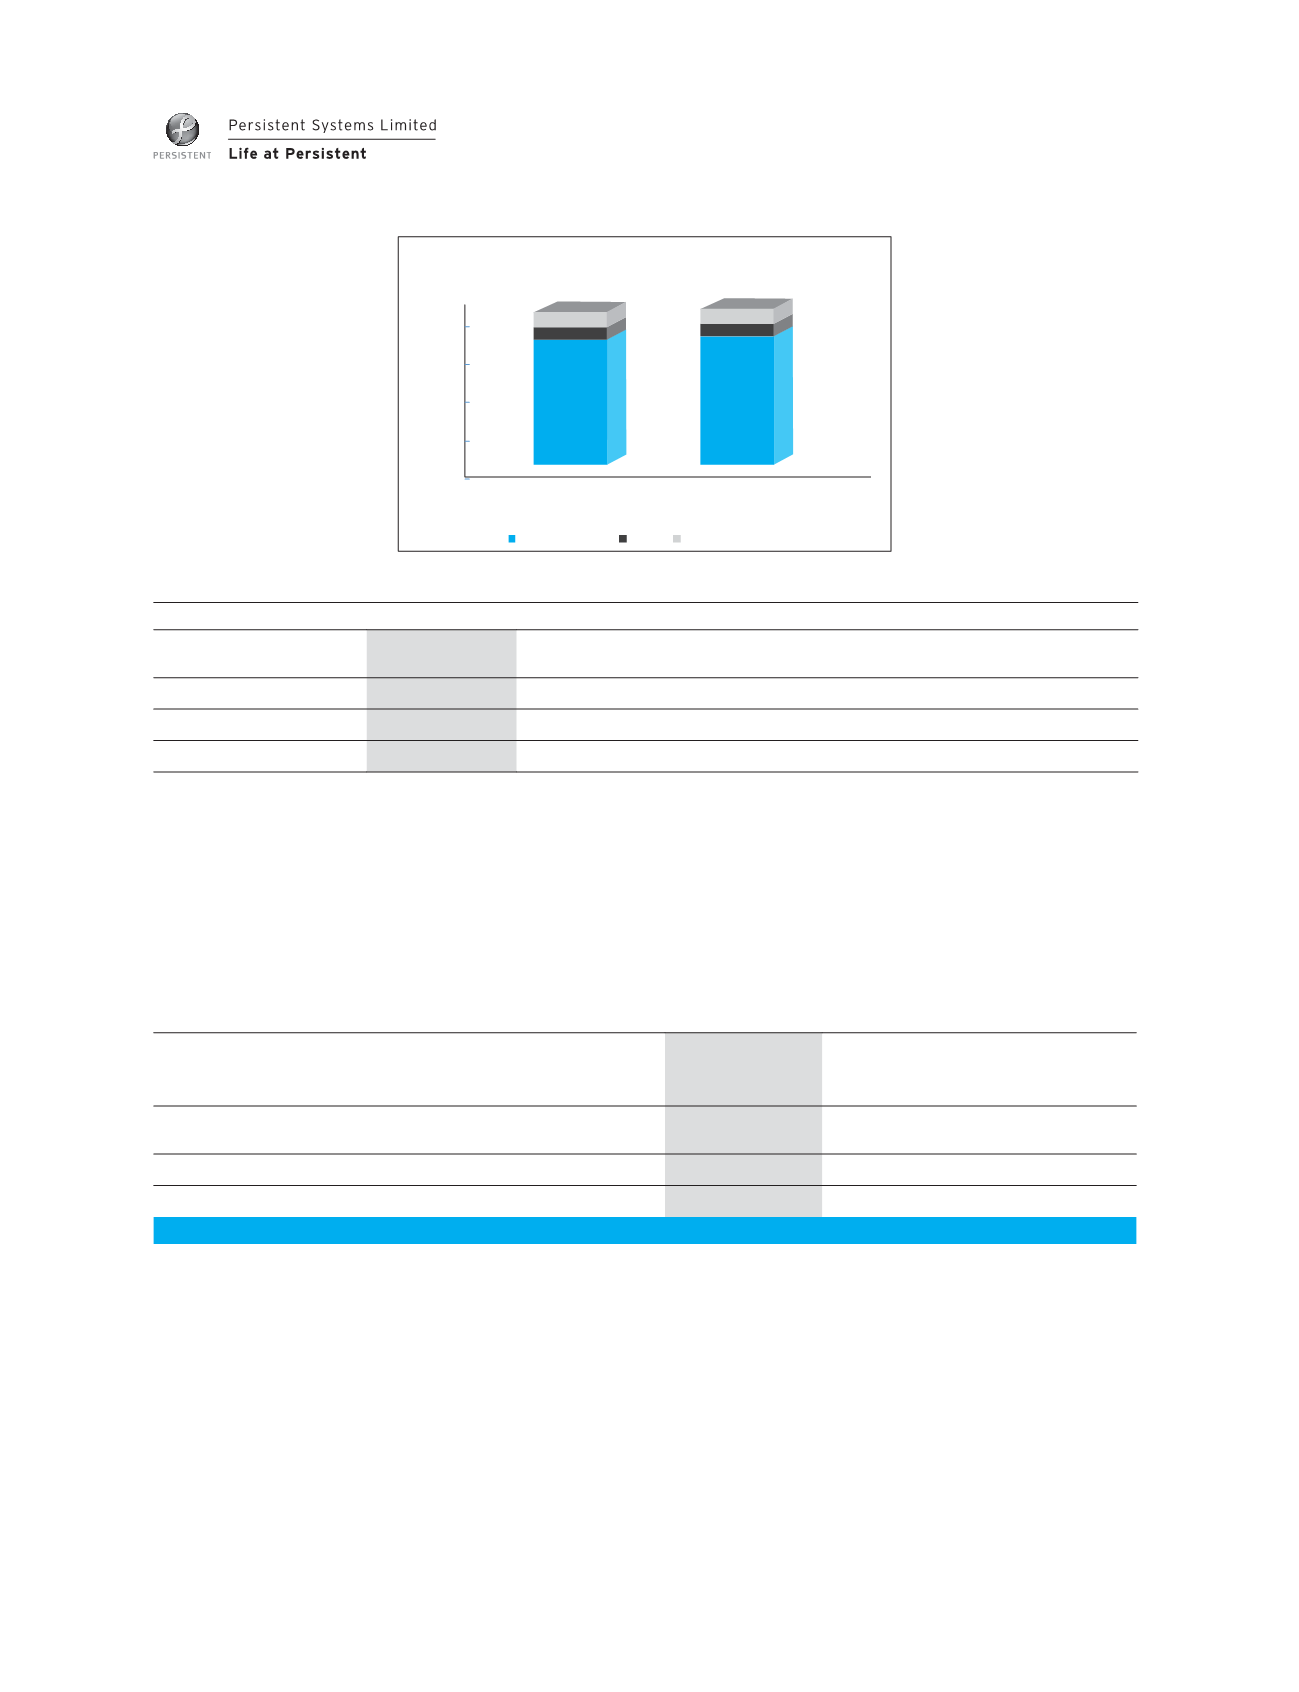
20.0%
40.0%
60.0%
80.0%
100.0%
2015-16
2016-17
85.5%
86.4%
6.7%
5.5%
7.8%
8.1%
Revenue Shares By Geographies
NorthAmericas
Rest of the World
India
Revenue percentage from repeat business remains at a high level of 85.6% (84.5% in the previous year).
Financial Year
Revenue
Concentration
2016-17
2015-16
2014-15
2013-14
2012-13
Top 1
28.3%
19.9%
18.4%
21.2%
20.4%
Top 5
44.6%
36.6%
35.8%
37.1%
34.7%
Top 10
53.1%
45.5%
45.2%
47.0%
46.0%
Other Income
As e[plained in Note 26 of the consolidated onancials, Other Income consists of income from investment of surplus
funds in the form of dividend and fair value gain from mutual funds, proot on sale of investments, interest on deposits
and bonds, foreign e[change gain and miscellaneous income. Other income has increased from
`
772.88 Million for
the year ended March 31, 2016 to
`
958.45 Million for the year ended March 31, 2017. The other income has primarily
increased on account of increase in the amount of the fair value of the mutual funds due to drop in interest rates. Also,
there has been an increase in foreign e[change gain by
`
121.99 Million mainly due to higher MTM gain on forward
contracts.
The details of other income are given below:
Particulars
Financial year
2016-17
(In
`
Million)
Financial year
2015-16
(In
`
Million)
Growth
Investment income (including interest, dividend, fair value
gain and proot on sale of investments)
618.42
585.18
5.68%
Foreign e[change gain
268.50
146.51
83.26%
Miscellaneous Income
71.53
41.19
73.66%
Total
958.45
772.88
24.01%