


 155 / 300

Annual Report 2016-17
•
155
March 31, 2017 as against
`
1,223.63 Million as at March 31, 2016. The components of short term provisions are given
below:
(In
`
Million)
Particulars
As at
March 31, 2017
As at
March 31, 2016
Provision for employee Beneots
Gratuity
10.32
49.70
/eave encashment
450.05
453.15
/ong service awards
26.34
24.18
Other Employee beneots
904.36
696.60
Total
1,391.07
1,223.63
The decrease in provision for gratuity is mainly due to higher contribution made to the insurer as compared to the
previous year. There is no signiocant movement in short term provision of leave encashment and long service award.
Other employee beneot liability has increased on account of increase in performance bonus and retention bonus
payable as on March 31, 2017.
Revenue from Operations (Net)
The Company provides product engineering services, platform based solutions and IP-based software products to its
global customers. The Company derives a signiocant portion of its revenues from e[port of software services and
products.
The revenue for the year in USD terms was up by 22.0% at USD 429.01 Million against USD 351.65 Million in the previous
year. In Rupee terms the revenue was
`
28,784.39 Million against
`
23,123.31 Million representing a growth of 24.5% over
the previous year. The rupee depreciated by 2.0% during the year against US Dollar.
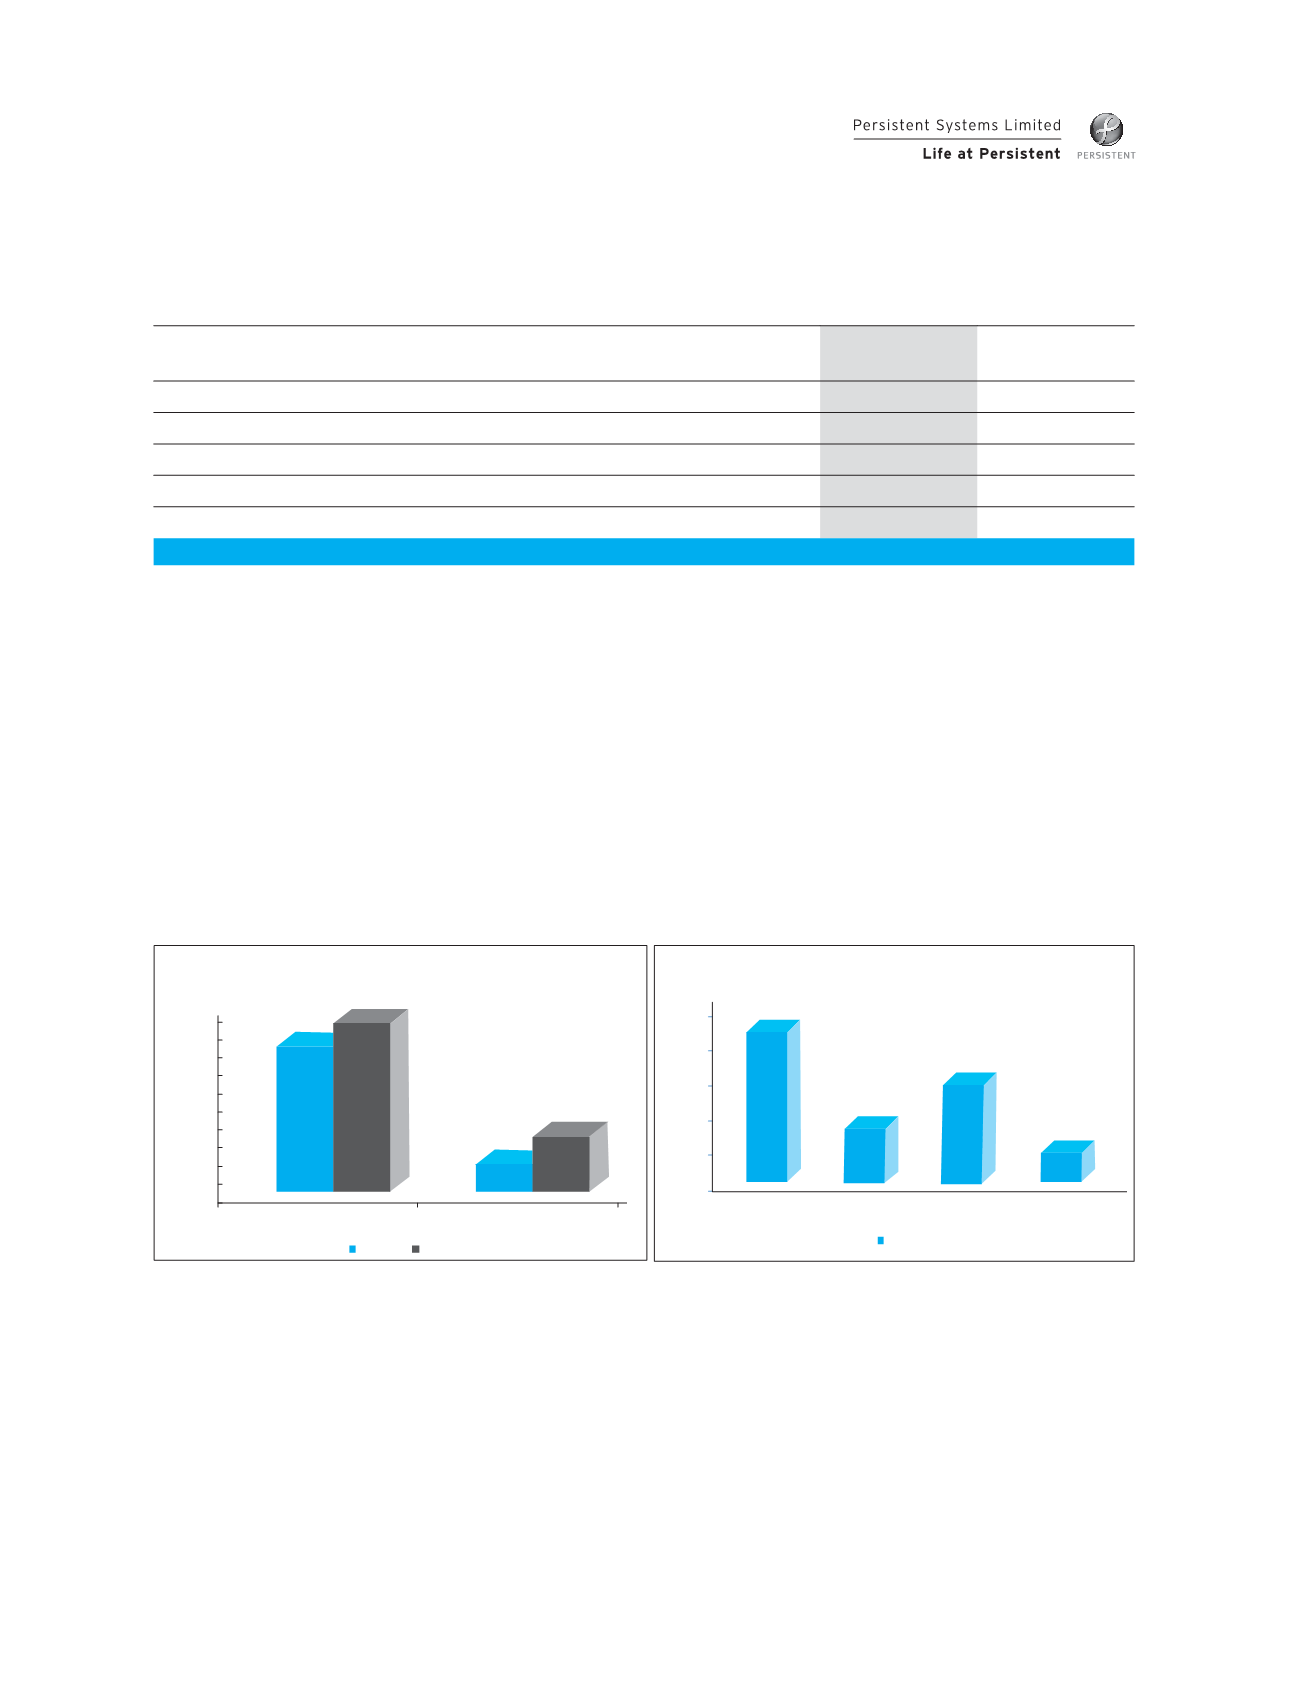
During the year the growth in revenue was driven by growth in both, IP /ed and software services which recorded a rise
of 64.9% and 13.6% respectively in INR terms.
2,000
4,000
6,000
8,000
10,000
12,000
14,000
16,000
18,000
20,000
22,000
SoŌwareServices
IPLed
18,239
4,884
20,727
8,057
Revenue by oīerings in ༤ Million
2015
-16
2016
-17
3,000
6,000
9,000
12,000
15,000
Services
Digital
Alliance
Accelerite
(Products)
13,086
4,705
8,466
2,527
Revenue Shares By Segments ༤ Million
2016-17
The Company reorganised itself into four business units during the year, which are considered as business segments.
The graphical presentation of the contribution of the segments in the total revenue is given above.
As the Company reorganised itself into 4 business units effective from April 1, 2016, discrete onancial information for
these business units/ operating segments for the earlier periods is not available. Hence, the comparative information
for the year ended March 31, 2016 is not provided.
In terms of geographical mi[ of revenue, North American region continued to dominate by contributing 86.4% of the
total revenue. Contribution from Indian region was 5.5% while the geographies other than North America and India
(i.e. Rest of the :orld) contributed 8.1% of total revenue. Revenue in INR terms grew by 25.7% from North America,
3.6% from India and 29.1% from the Rest of the :orld regions as compared to the previous year.