


 158 / 327

158
• Annual Report 2018-19
Shaping the future of software driven business
xvi. Shareholders (other than Promoters) holding more than 1% of the share capital as on March 31, 2019
Sr.
No
Name of Shareholder
No. of Shares Percentage holding
1
HDFC Trustee Company LTD. - A/C HDFC Capital Builder Value Fund
3,727,258
4.68
2 L&T Mutual Fund Trustee Limited - L&T Emerging Business Fund
3,387,188
4.25
3 Government Pension Fund Global
2,324,258
2.91
4 PSPL ESOP Management Trust*
2,135,409
2.68
5 Tata Mutual Fund - Tata Equity PE Fund
1,602,300
2.01
5 Letko Brosseau Emerging Markets Equity Fund
1,513,211
1.90
7 PPFAS Mutual Fund - Parag Parikh Long Term Equity Fund
1,412,592
1.77
8 ICICI Prudential Value Discovery Fund
1,347,123
1.69
9 Shridhar Bhalchandra Shukla
1,222,627
1.53
10 Ashutosh Vinayak Joshi
1,117,946
1.40
Total
19,789,912
24.85
* Shares held in the name of Trustees of PSPL ESOP Management Trust as on March 31, 2019.
xvii. Market Price Data
The equity shares of the Company were listed on the BSE Limited (BSE) and the National Stock Exchange of India Limited
(NSE) on April 6, 2010. Accordingly, the highest traded price and the lowest traded price and total volume for the period from
April 1, 2018 to March 31, 2019 on a monthly basis are as below:
Month ended
<----------------- BSE ----------------->
<----------------- NSE ----------------->
High (
`
)
Low (
`
) Total Volume (No.)
High (
`
)
Low (
`
) Total Volume (No.)
Apr-18
825.00
658.00
540,695
781.00
657.00
6,939,104
May-18
866.90
759.00
254,907
868.00
756.00
4,253,472
Jun-18
843.50
732.00
349,522
845.00
733.00
2,516,971
Jul-18
880.00
792.40
682,770
874.00
790.00
4,640,729
Aug-18
890.00
811.05
400,431
889.90
810.70
4,133,892
Sep-18
915.00
772.40
246,976
915.00
771.25
4,160,383
Oct-18
785.70
540.00
387,730
787.95
536.00
7,864,788
Nov-18
610.00
532.80
208,326
610.00
532.30
4,167,327
Dec-18
641.05
590.00
115,207
642.00
590.00
3,375,810
Jan-19
643.50
537.00
744,874
695.85
591.10
8,888,388
Feb-19
673.80
592.80
252,862
675.10
561.00
4,077,586
Mar-19
693.05
625.15
160,965
644.35
538.55
3,102,647
(Source:
www.bseindia.comand
www.nseindia.com)
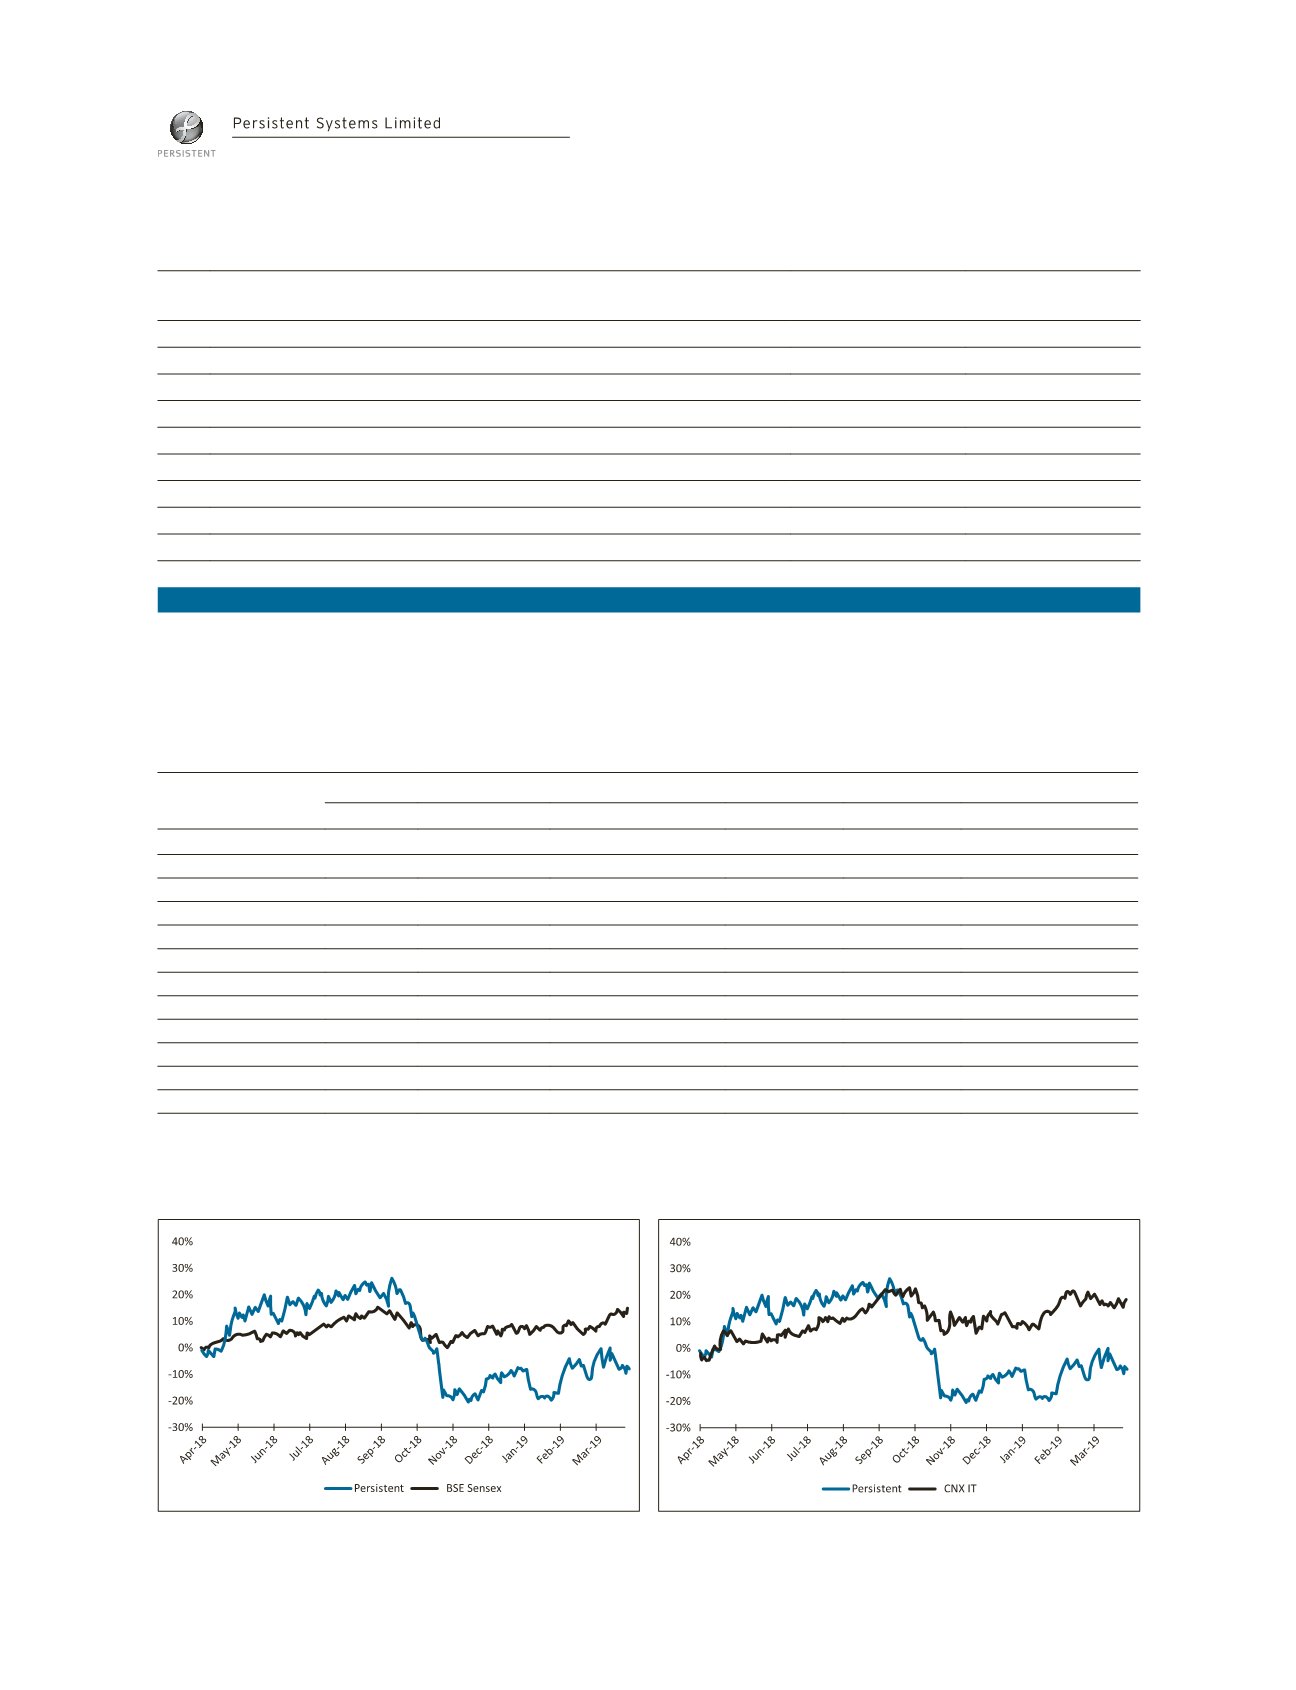
Graphical presentation of Persistent movement of Company’s stock price as compared to Nifty and Sensex from April 1, 2018
to March 31, 2019 is as follows: