


 49 / 327

Shaping the future of software driven business
•
49
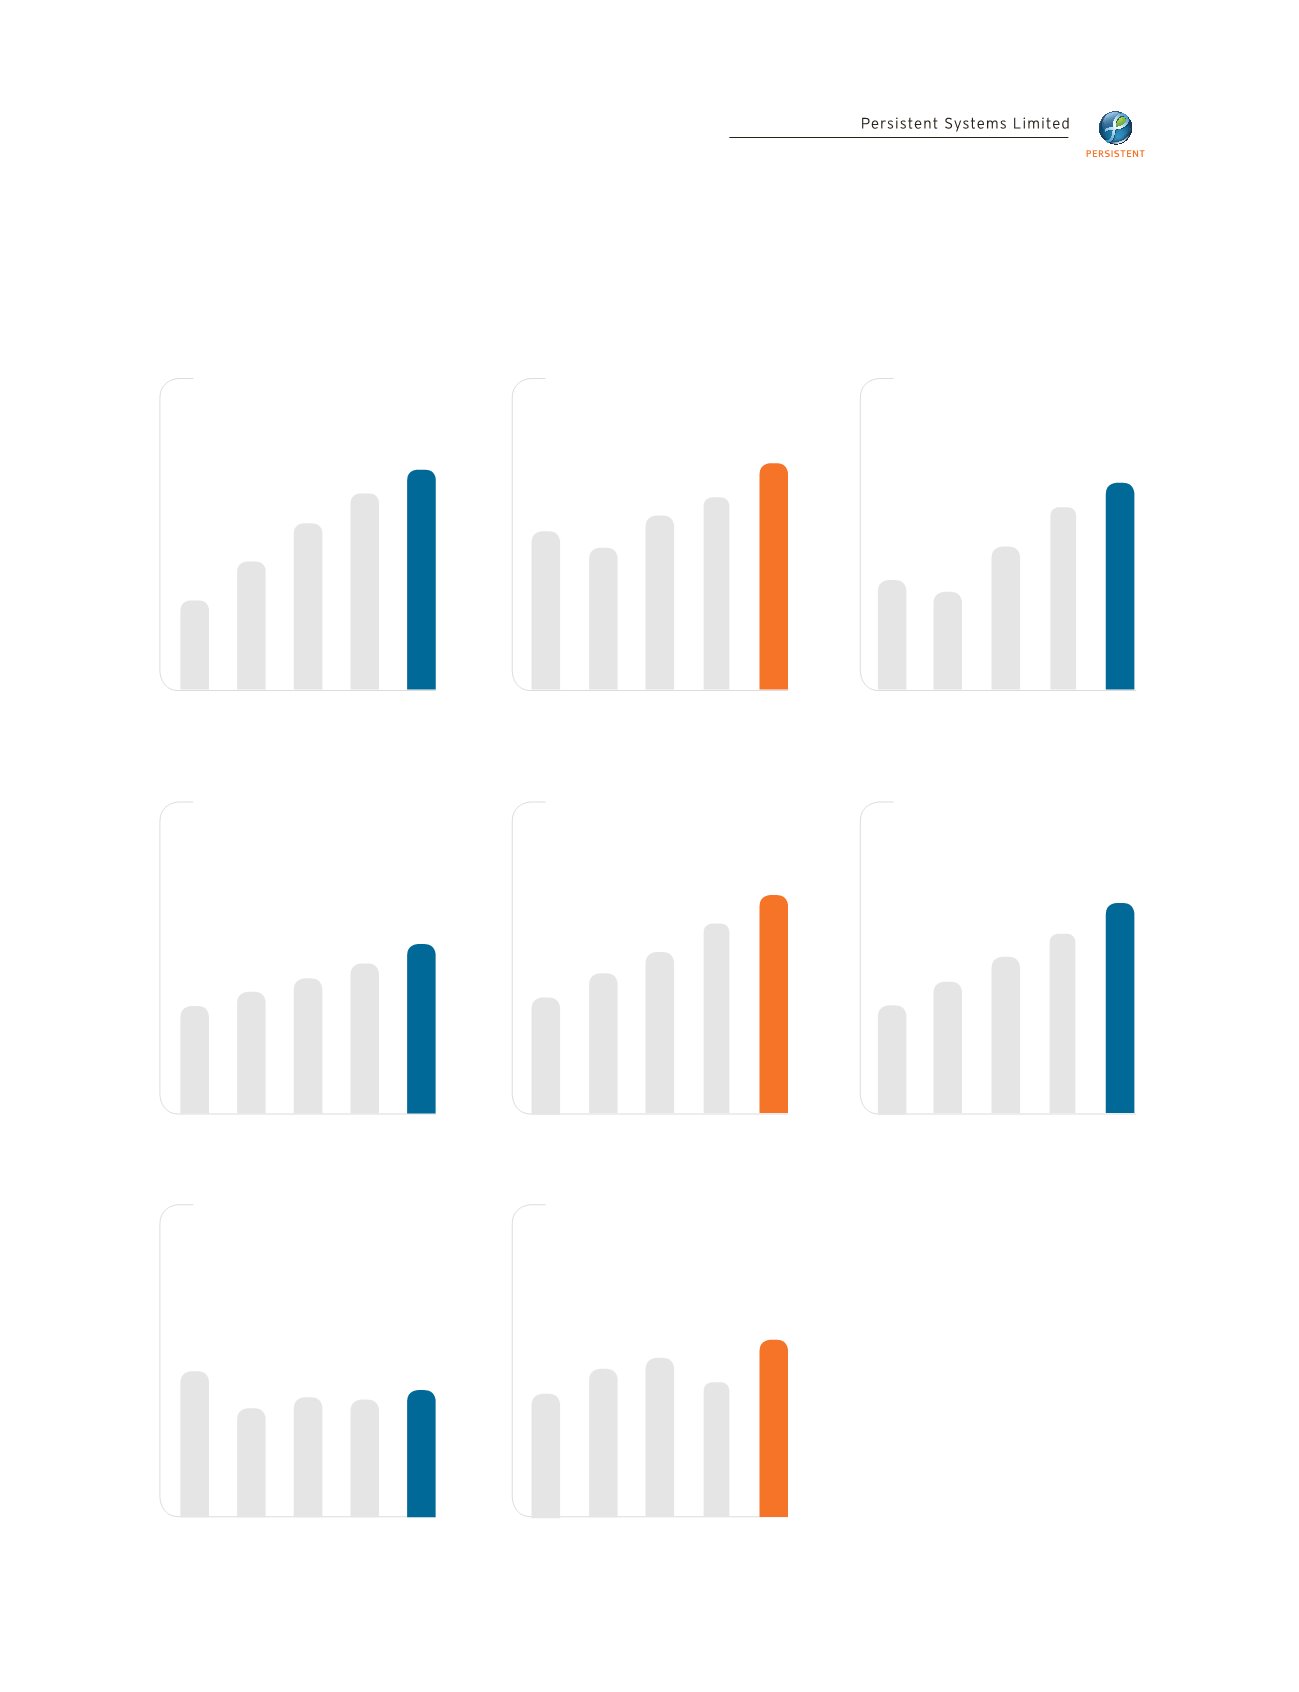
2015 2016* 2017* 2018* 2019*
2015 2016* 2017* 2018* 2019*
2015 2016* 2017* 2018* 2019*
2015 2016* 2017* 2018* 2019*
2015 2016* 2017* 2018* 2019*
2015 2016 2017 2018 2019
2015 2016* 2017* 2018* 2019*
2015 2016* 2017* 2018* 2019*
*
Figures from FY 2015-16 to FY 2018-19 are
stated as per Ind AS whereas the figures
for FY 2014-15 are stated as per IGAAP.
**
EPS is computed after considering the
impact of exceptional item.
#
Equity Share Capital, Reserves and
Surplus (excluding Gain on bargain
purchase) and Other Comprehensive
Income are considered for the purpose
of computing Net Worth and Book Value
per share.
^
Considering aggregate payout of dividend
and dividend distribution tax (including
proposed dividend and tax thereon).
33.08
27.78
28.75
8,506
9,264
9,962
9,460
Total Revenue
In
`
Million
Fixed Assets
(Gross block, including Capital
work-in-progress and intangibles
under development)
In
`
Million
Dividend Payout Ratio^
Percentages
Profit After Tax
(After exceptional items)
In
`
Million
Net Worth
#
In
`
Million
Persistent Team
(Including trainees and associates)
Numbers
Earnings Per Equity
Share**
In
`
Book Value per share
#
In
`
Financial Year ending on March 31
18,912.52
23,123.31
28,784.39
30,337.03
2,906.31
2,772.99
3,014.65
3,230.88
36.84
34.74
37.68
40.39
9,423.72
11,168.67
12,691.97
13,782.44
14,055.29
16,504.58
18,968.38
175.69
206.31
237.41
33,659.41
3,516.79
43.99
14,489.99
23,394.09
21,245.60
265.90
295.68
28.52
29.45
8,976
Highlights (Based on consolidated figures)
Highlights