


 188 / 327

188
• Annual Report 2018-19
Shaping the future of software driven business
81.7%
83.5%
The revenue for the year in USD terms was up by 2.21% at USD 480.97 Million against USD 470.55 Million in the previous
year. In Rupee terms the revenue was
`
33,659.41 Million against
`
30,337.03 Million representing a growth of 10.95% over the
previous year. The rupee depreciated by 8.55% during the year against US Dollar.
Product Engineering Services revenue, comprising 75.08% of total revenue, at USD 361.12 Million (INR 25,278.22 Million) grew
by 3.2% in USD terms and 12% in INR terms, IP led revenue, comprising 24.92% of total revenue, at USD 119.85 Million (INR
8,381.19 Million) was lower by 0.5% in USD terms grew at 7.9% in INR terms.
The share of enterprise revenue to total revenue for the current year has increased to 35.26% as against 34.47% for the
previous year and increase in revenue in absolute terms was 4.6%.
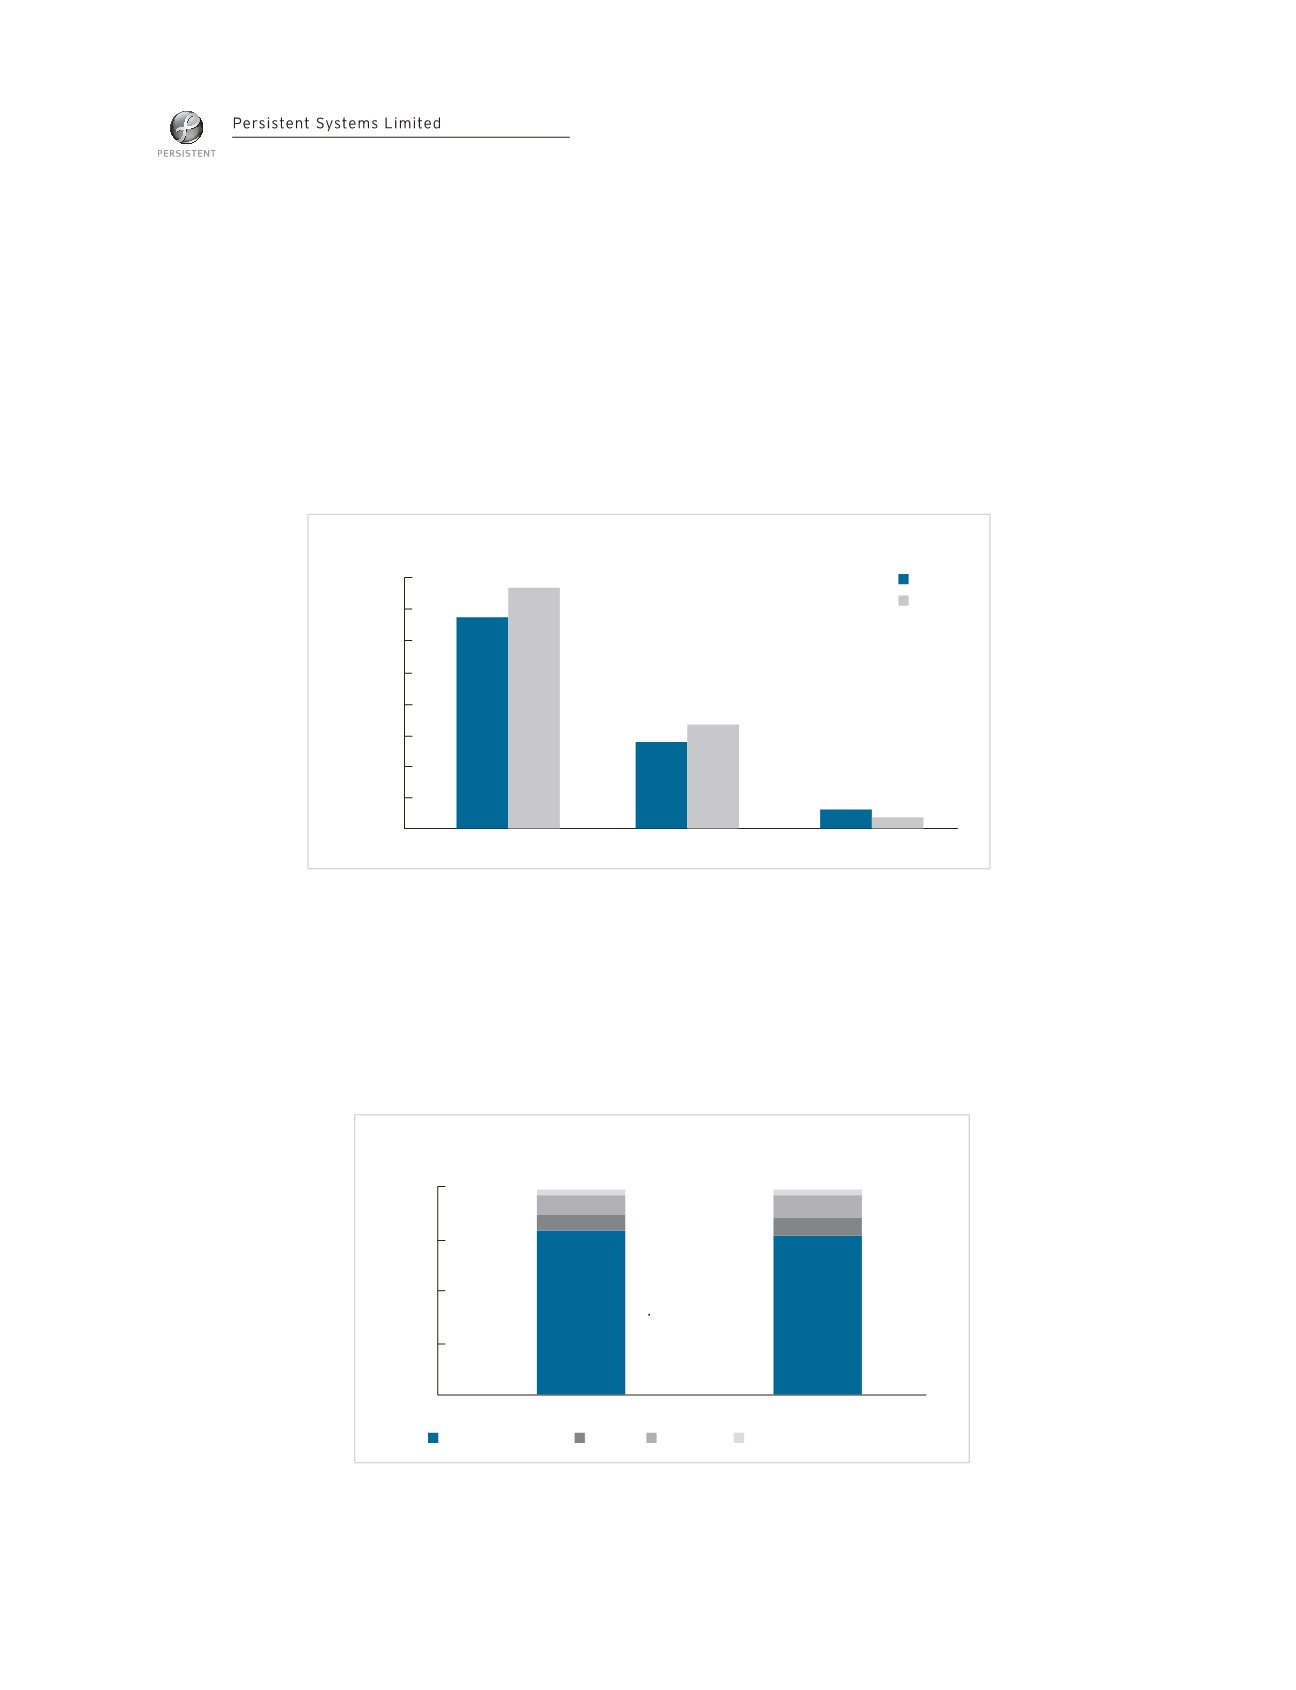
Following is the graphical presentation of the contribution of the segments in the total revenue:
As regards IP led revenue, Alliance segment registered an increase of 12.2% in IP led revenue. Accelerite segment revenue
declined from USD 34.35 Million in FY 2017-18 to USD 26.93 Million in FY 2018-19. This was due to discontinuation of two
products which had completed their life cycle towards the end of the year and longer sales cycle for new products.
Further, in terms of geographical mix of revenue, North American region continued to dominate by contributing 81.7% of the
total revenue. Contribution from India region was 7%, Europe was 8.8% while rest of the World contributed 2.5% of total
revenue. Revenue in INR terms grew by 8.6% from North America, 23.0% from India and 23.1% from the Rest of the World
regions as compared to the previous year.
Revenue Shares by Segments
`
Million
2017-18
2018-19
North Americas
India Europe Rest of the World
19,371
2.7%
2.5%
7.5%
8.8%
6.3%
7.0%
22,018
Technology Services
Alliance
Accelelrite (Products)
3,000
6,000
9,000
12,000
20.0%
40.0%
60.0%
80.0%
100.0%
15,000
18,000
21,000
24,000
8,725
9,760
2,241 1,881
2017-18
2018-19
Revenue Shares by Geographics